


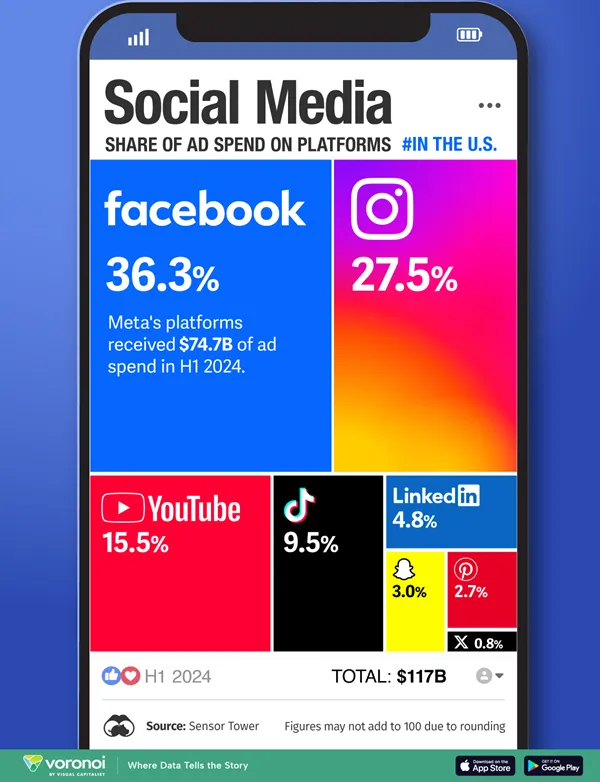
We all know that Meta is he grand champion of the social media revenue stakes, but just how dominant is Zuck’s social behemoth when it comes to ad intake, and how other platforms stack up?
That’s the focus of this visualization from Visual Capitalist, which compares the social media ad spend among the major players.
The data is based on social ad spending in the first half of 2024, using data sourced from app intelligence provider Sensor Tower. So there may be variances in the current time period, and each app also has other sources of revenue. But advertising is where they make most of their money, which makes this an indicative overview of where they’re currently placed.
An interesting look at the state of play. You can read more in Sensor Tower’s “State of Digital Advertising Report” here.

Snapchat Launches Interactive Art Project at the Palace of Versailles
Snapchat has announced a new in-app art project, in partnership with the Palace of Versailles, which aims to provide an...

X Wins Free Speech Case in Australia
X has claimed another victory for free speech, this time in Australia, where it’s won another challenge against the rulings...

This-Party Ad Measurement Partners Announce New Snap Attention Measurement
This is slightly awkward, though a win for advertisers either way. Today, both Integral Ad Science (IAS) and DoubleVerify have...

TikTok Launches Bulletin Boards for Broadcast Messaging from Creator and Brand Profiles
TikTok’s experimenting with its own variation of broadcast channels, which enables brands and creators to share message updates with their...